
Issue 1: The $6 Customer That Actually Cost $271
Their ROAS looked great. Their tracking was lying to everyone, including the algorithm.

I got on a sales call with a prospect and told them something their agency had never mentioned: their tracking wasn’t set up right.
They weren’t alarmed. They weren’t even sure they believed me. They were just... quietly confused about why their ads never seemed to match what was happening in the business. They had taken it for granted that the numbers were never going to line up — so instead of digging into why, they just kept paying the “Google tax” and hoped that more spend would eventually move the needle.
It never did.
That confusion is exactly what a mirage looks like from the inside.
Here’s what I found when I got into the account.

The Mirage
The client had server-side conversion tracking set up through Elevar — which, on the surface, is actually the more sophisticated approach. Better data capture, harder to block. Their agency had done something right.
But there were two problems nobody had addressed.
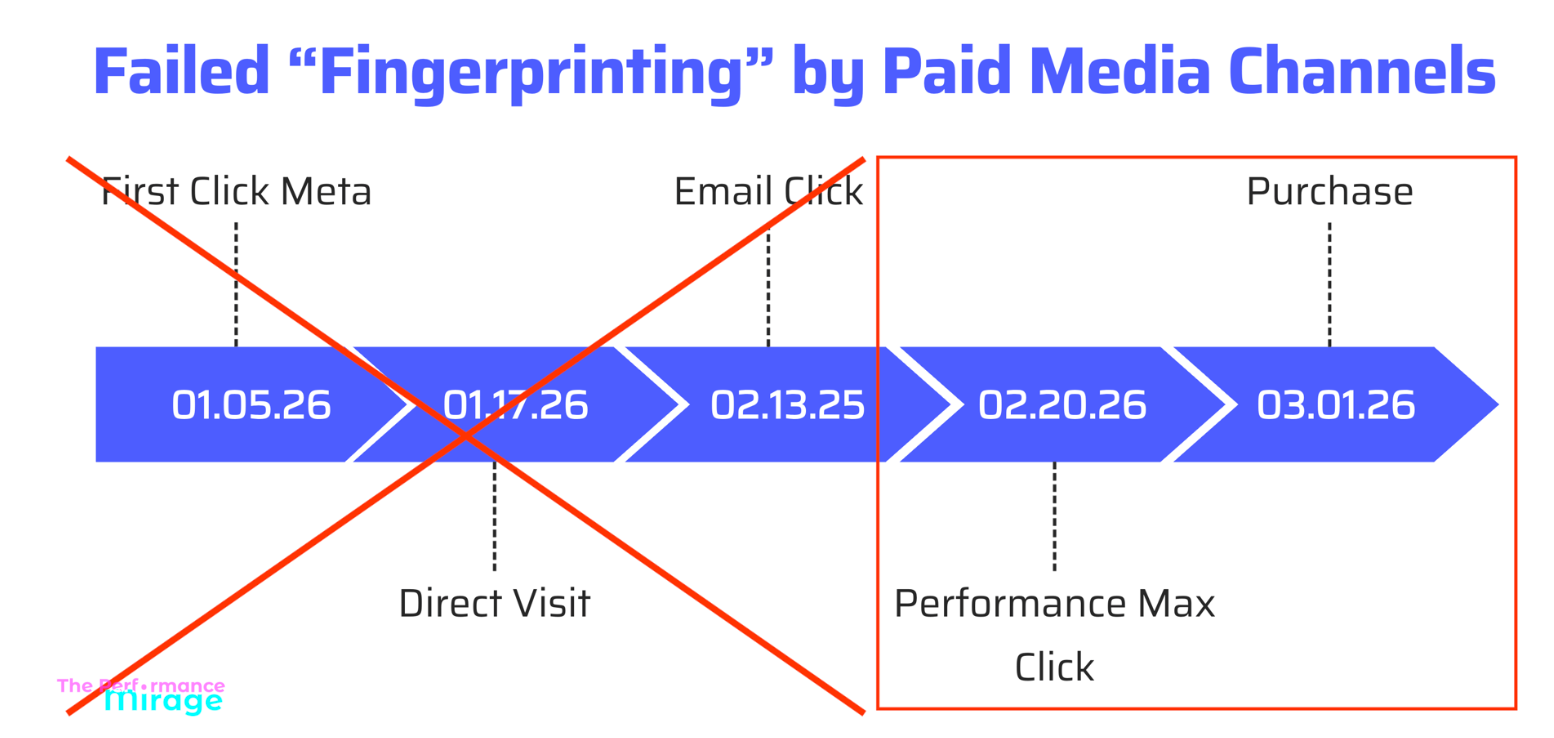
The first: the setup couldn’t distinguish between new customers and returning ones. Every purchase looked the same to the algorithm — a conversion is a conversion. So when a loyal customer who had been buying from them for two years clicked an ad and purchased, Google took credit. When someone came in from email, clicked a retargeted ad on the way, and bought — Google took credit. When someone searched their brand name because they were already going to buy — Google took credit.
The second: they also had a physical retail store — and nobody had filtered out the POS sales channel in Shopify. That store was actually doing more revenue and transactions than the online store. Which means the majority of what Google Ads was claiming credit for had nothing to do with Google Ads.
The ROAS looked great. The algorithm was thrilled. It kept doing more of what it thought was working.
This cuts both ways. A 36x ROAS sounds incredible — but if it were real, why wasn't the business scaling immediately? The number itself is the red flag.
What it was actually doing was recycling warm audiences and claiming credit for in-store sales — and calling all of it performance.
When this becomes the agreed-upon measure of success — and the agency never speaks up — there are only two explanations: negligence or malice. Either way, they should be fired.
The Shift
The next step was clear. Three core changes to get this account back on track, understand what was really happening, and — more importantly — feed the algorithm the right data.
1. Filter the POS sales channel out of conversion tracking. We excluded in-store purchases from what was being reported back to Google Ads. The algorithm could now only see — and optimize toward — actual online revenue.
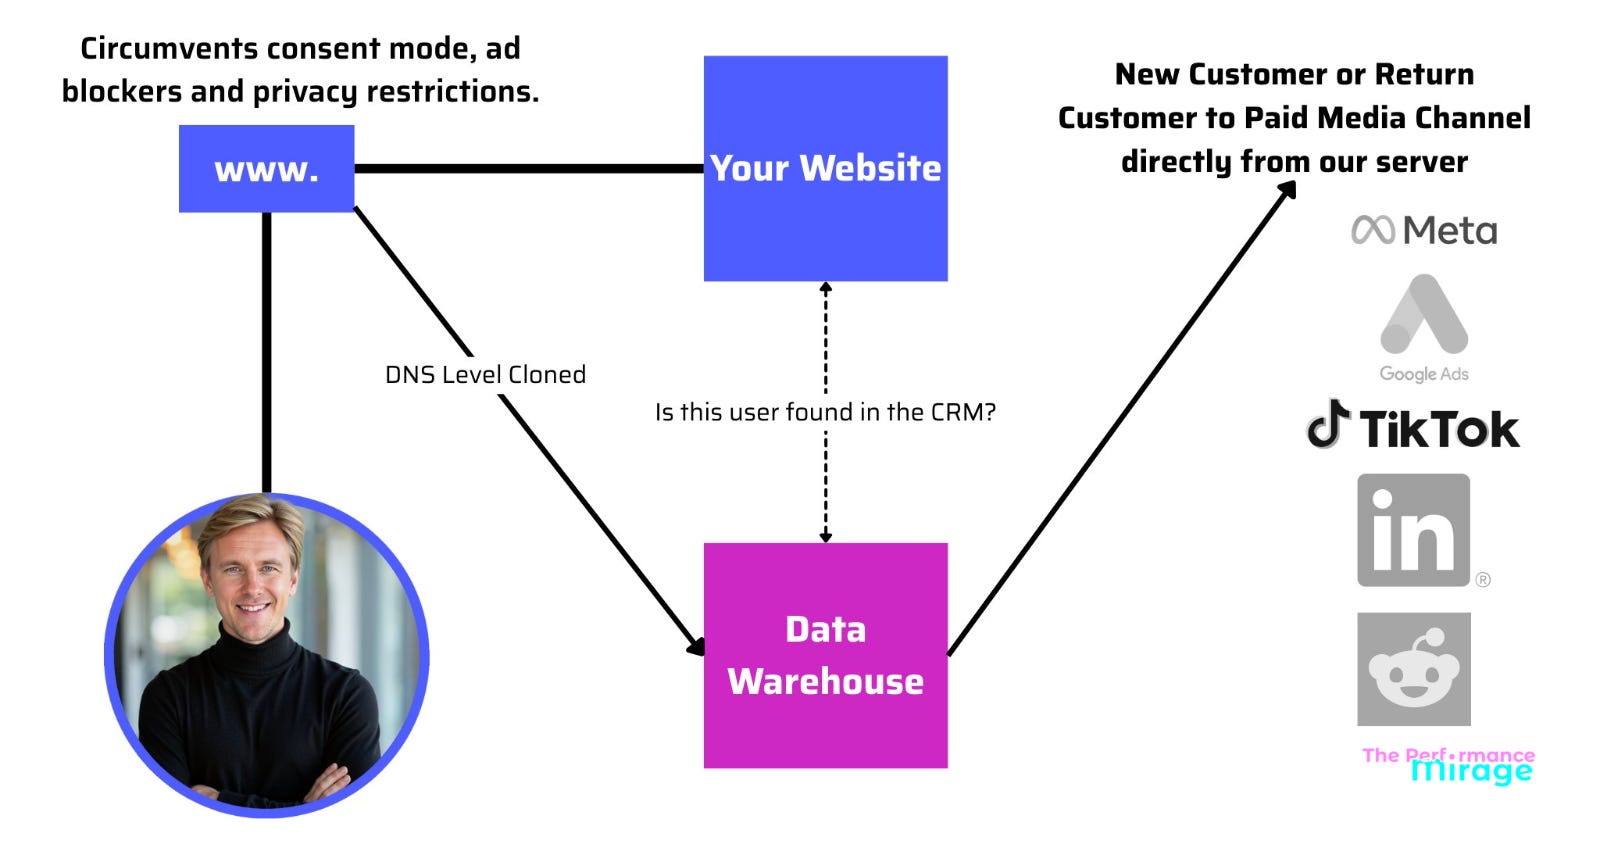
2. Implement OccamizeOS network tagging to separate new and returning customer conversions — and capture 100% of clicks. Returning customers are valuable. But they’re largely going to buy with or without your ads. Letting the algorithm take credit for them inflates your numbers and trains it to chase the wrong audience. With OccamizeOS in place, we had a clear, accurate signal of what the ads were actually driving in net-new acquisition. A simple rule of thumb: if more than 10% of your budget is going toward repeat buyers, you’re spending too much on them. Full stop.
3. Restructure the campaigns around clean data. Once the signal was clean, we rebuilt the campaign structure around it. The algorithm finally had an accurate picture of what a real new customer looked like — and it could start finding more of them.
None of this required a new tool the client had to learn. No new budget. No new strategy. It was diagnostic work first — understanding what the data was actually measuring before deciding what to do with it.
The Result
Within the first week, the account was operating on clean data for the first time.
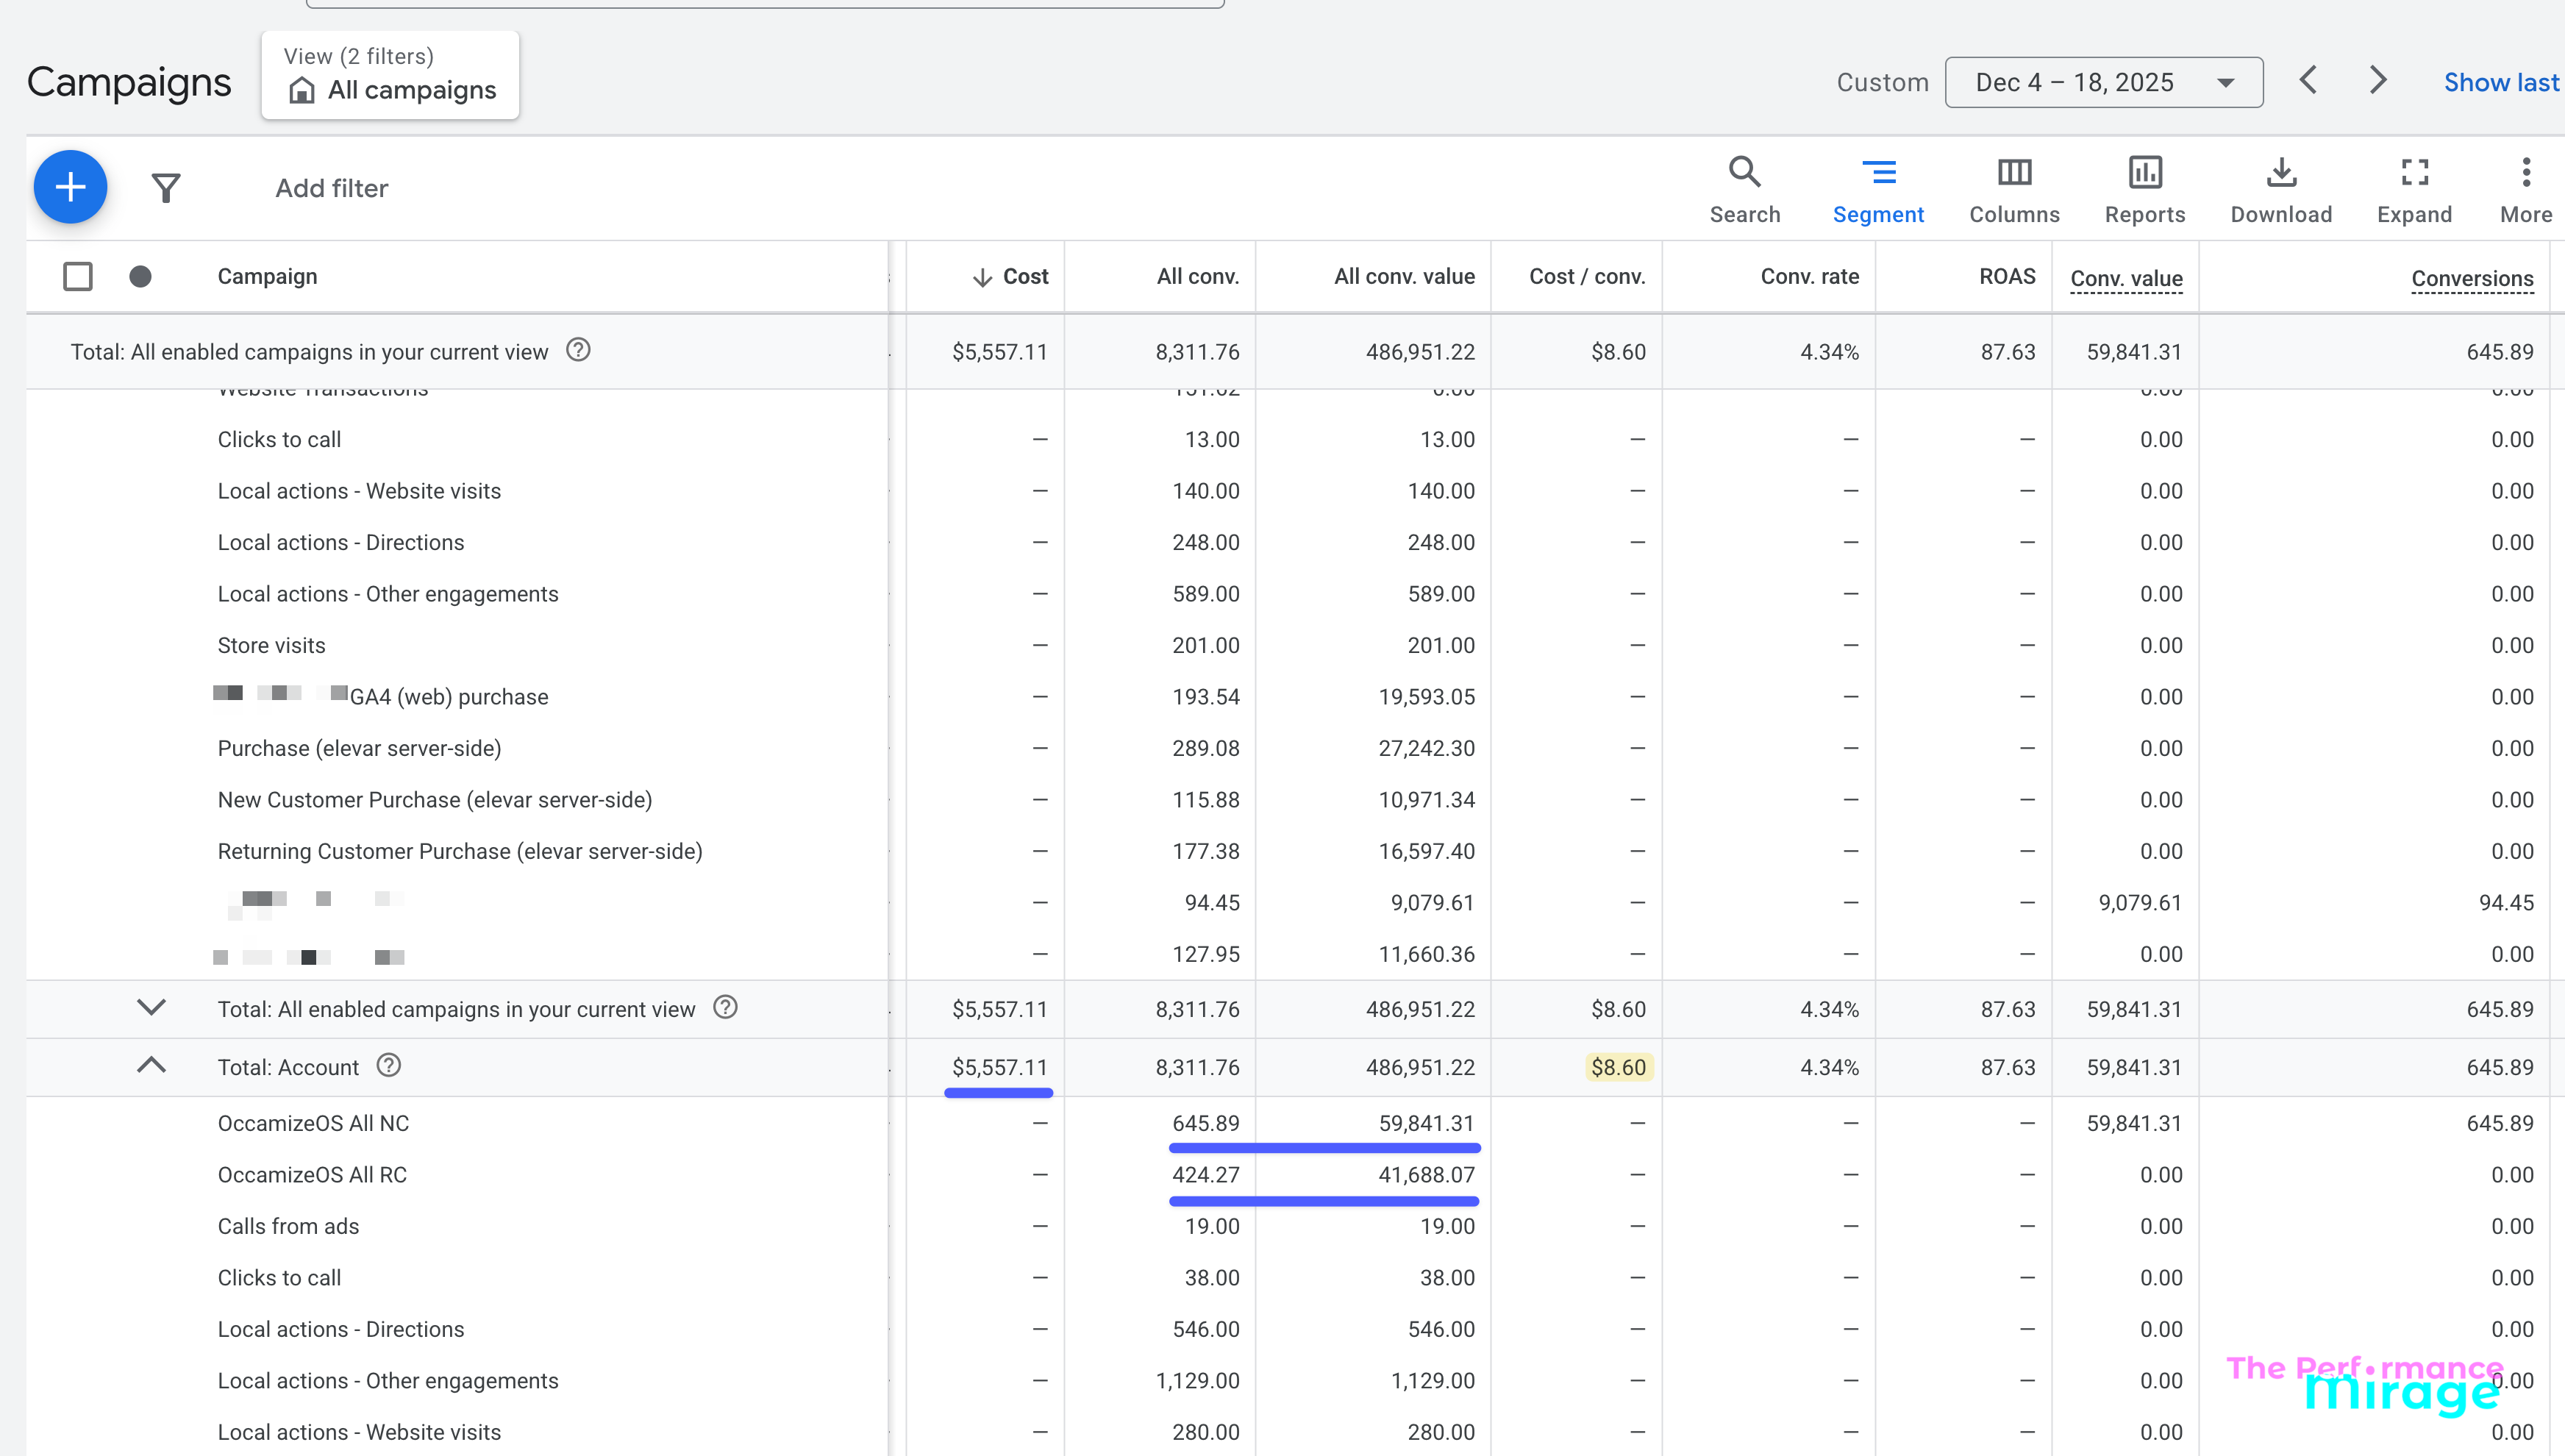
To understand what new customer acquisition had actually been costing them, we had to back into it. We took their total ad spend over the date range, identified any Shopify orders that came from a Google Ads click, and divided cost by those first order conversions. That was the only way to reverse-engineer a real nCAC — because Google Ads is already a bottom-of-funnel, high-intent channel, so attributing those clicks to new customer acquisition was a reasonable proxy. It wasn’t perfect. But it was the closest thing to the truth the old setup would allow.
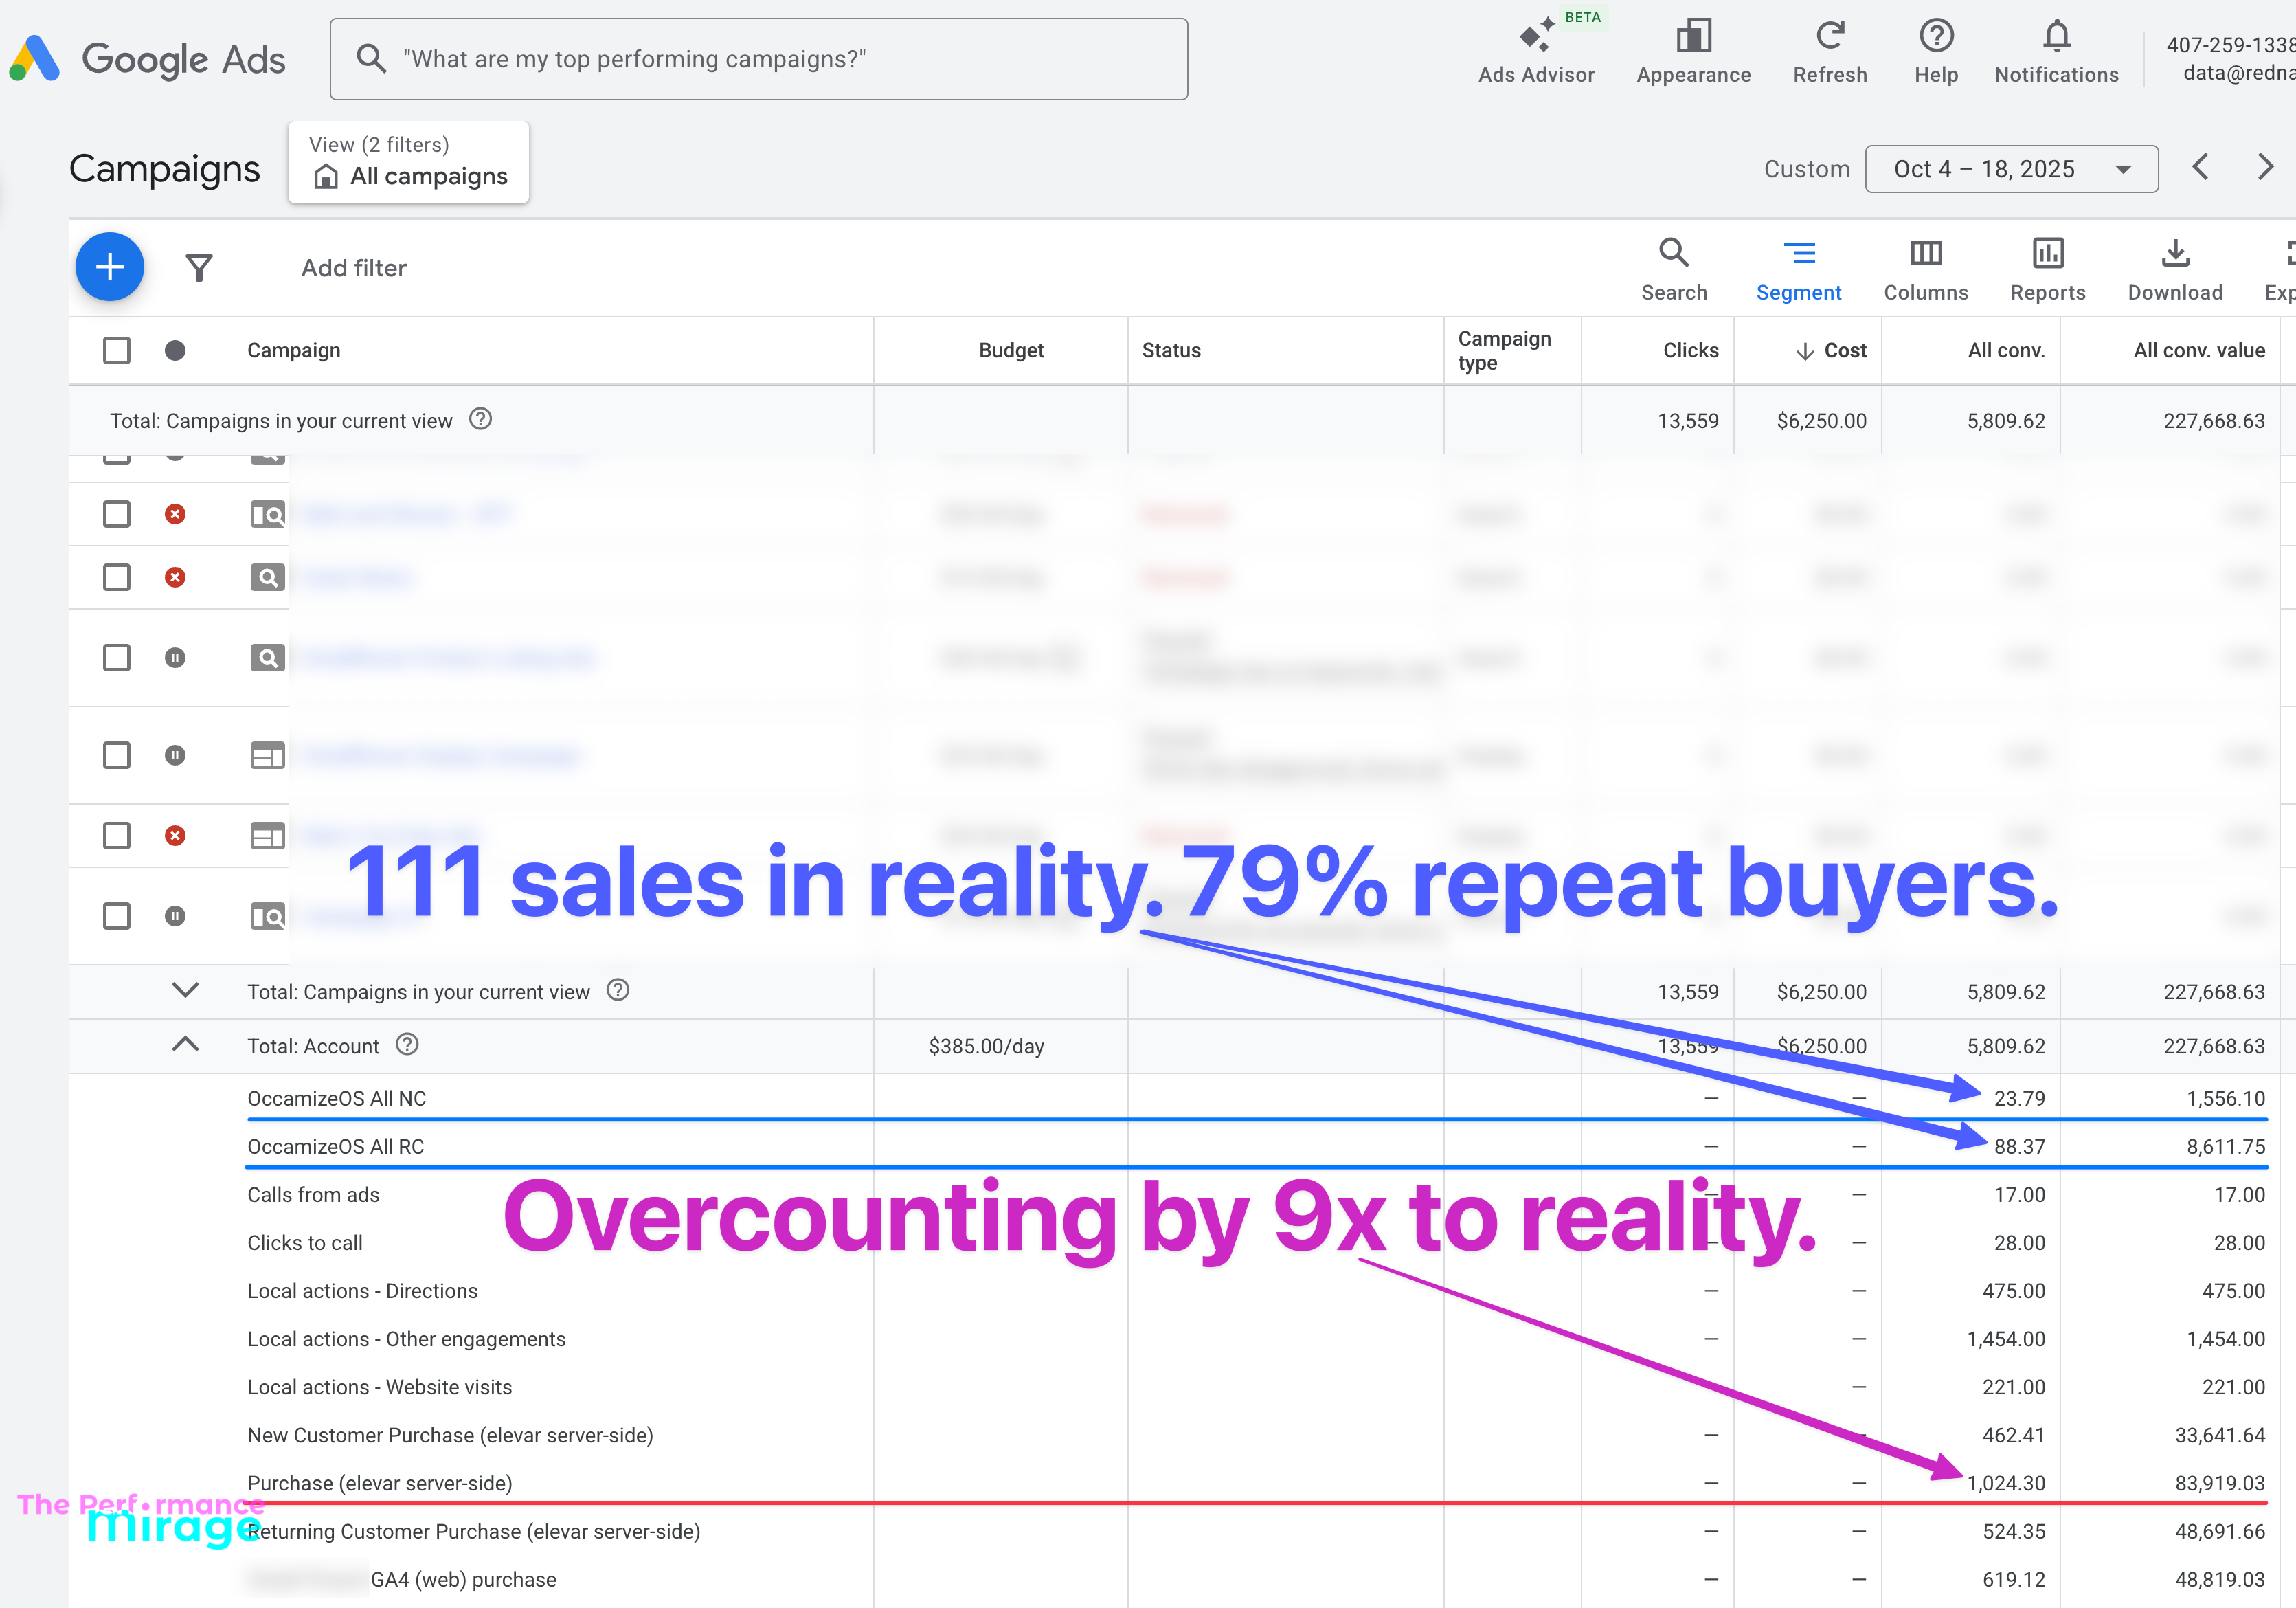
Here’s what that math looked like: over a 15-day period, they spent $6,250 on Google Ads. Elevar reported 1,024 conversions at $6.54 each. But when we looked at only the 23 net-new customers acquired during that same window, the real nCAC was $271.74.
They thought they were getting new customers for $6.54. They were actually paying $271.74.
That clarity changed everything, including the media mix. They had been spending $16,000 a month on Google Ads. We pulled that back to $10,000 — which was what I thought they needed to hit their goals on that channel — and shifted the remaining budget to Meta.
The reason: they’re a visual brand with products that stop the scroll. Meta is a cold audience machine when you’re set up correctly, and we knew that’s where their next wave of first-time customers was going to come from.
The reason: they’re a visual brand with products that stop the scroll. Meta is a cold audience machine when you’re set up correctly, and we knew that’s where their next wave of first-time customers was going to come from.
By month one, nCAC had dropped from $271.74 to $8.90 (and this is just in-platform but remember, this is network-tagged so it’s directionally more accurate…that said, we always look at all ad spend / 1st click CAPI imported new customers to get that real number in a spreadsheet)
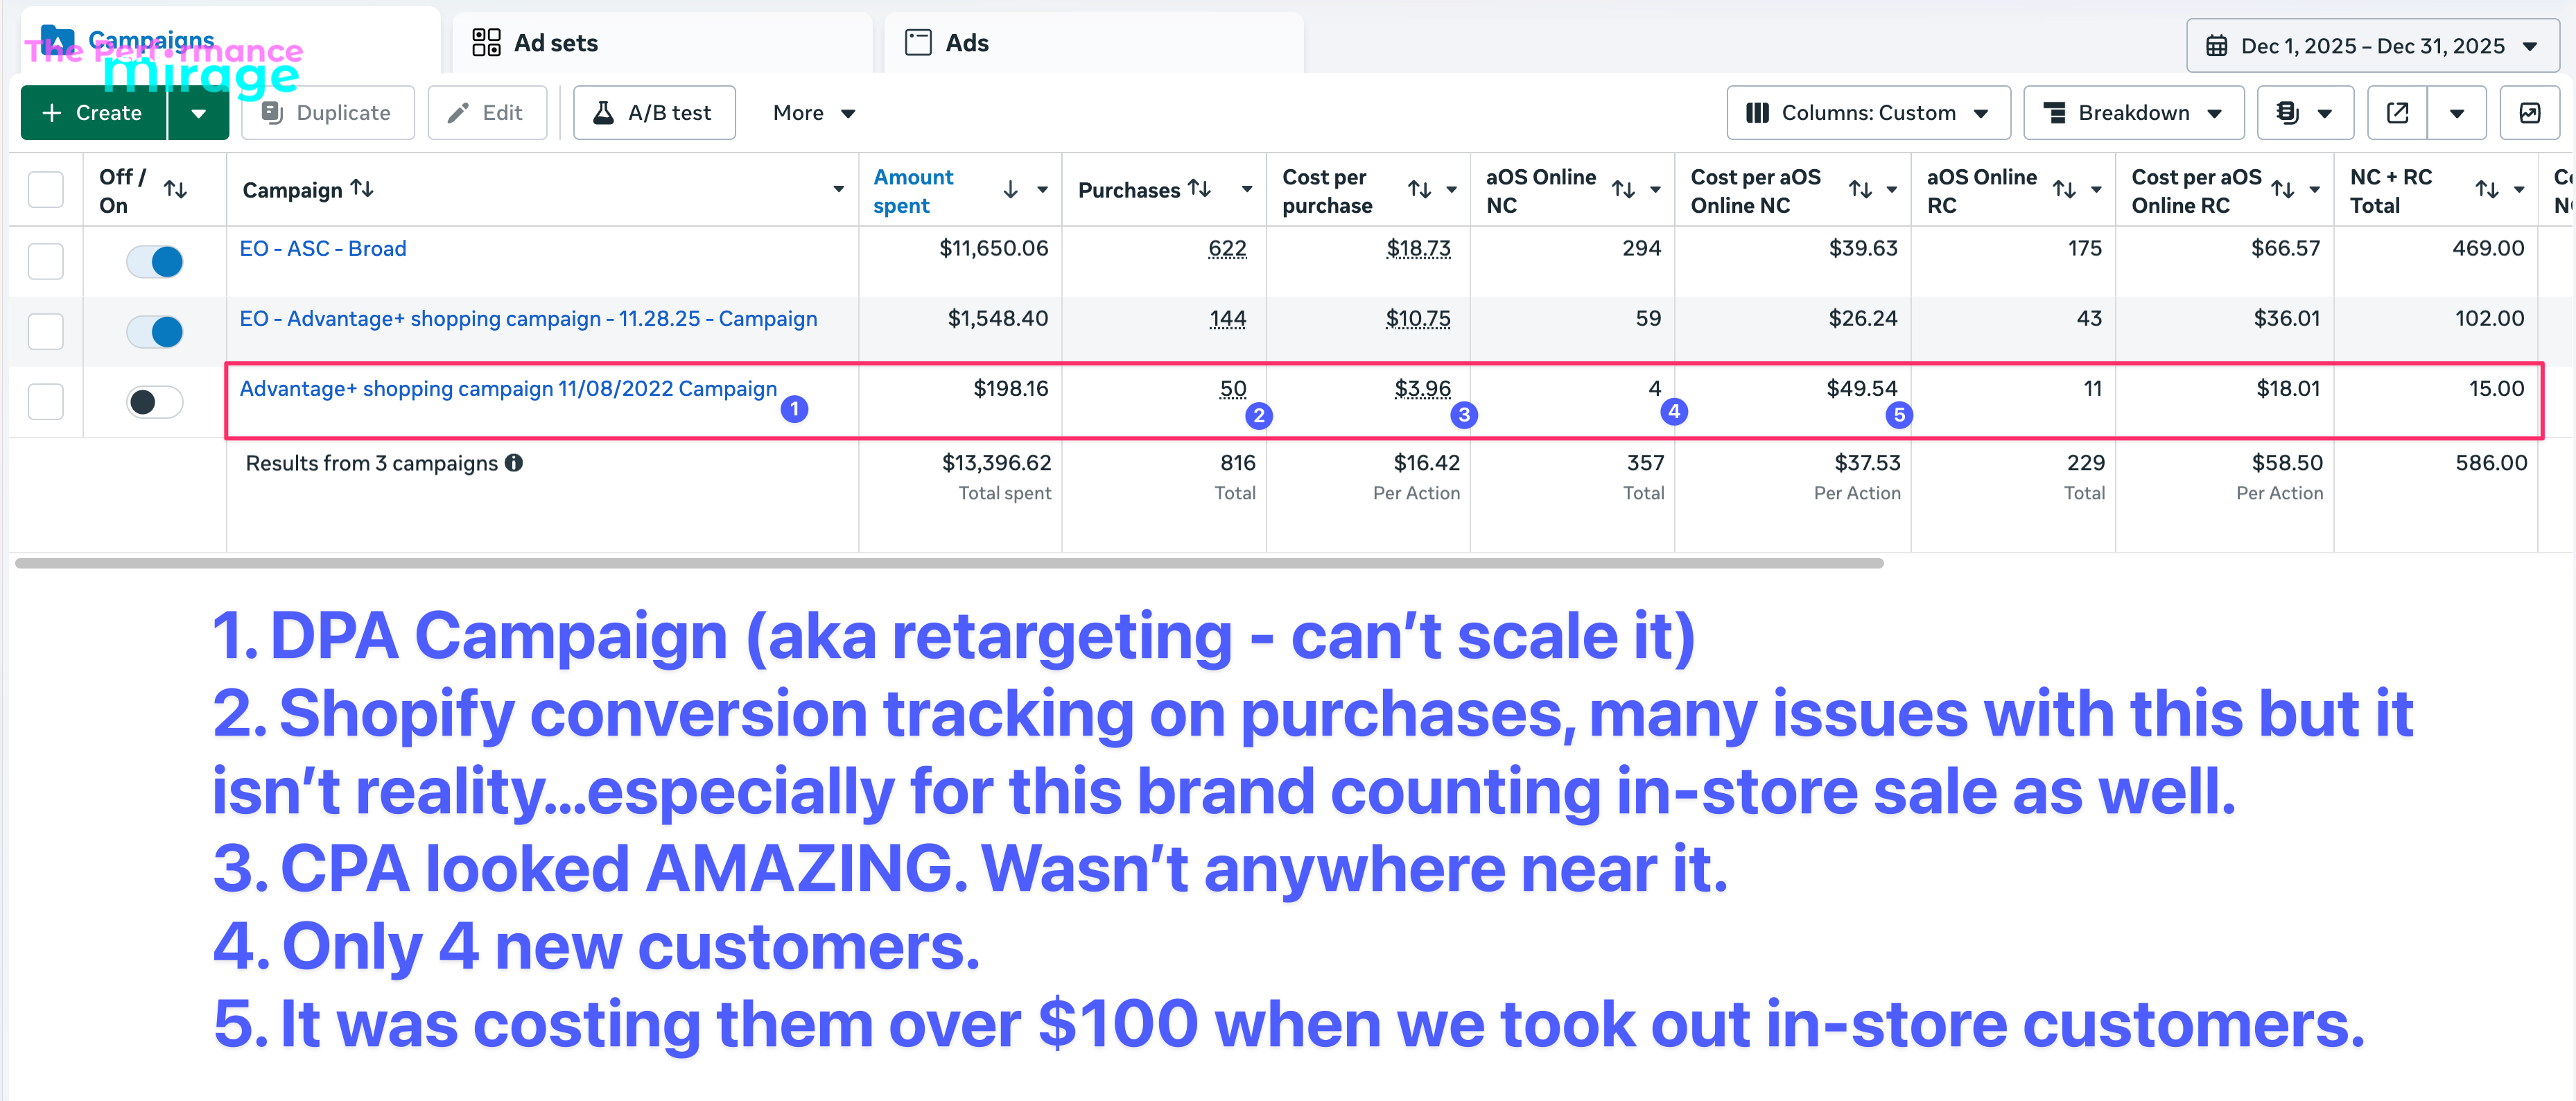
Before we started working with them, Meta was running a single DPA campaign — essentially a retargeting loop with no way to distinguish new from returning customers. Once we implemented network tagging, we could see the full picture for the first time: first-click, edge-tagged CAPI imports, new vs. returning split, and in-store traffic filtered out.
Here's what that revealed:
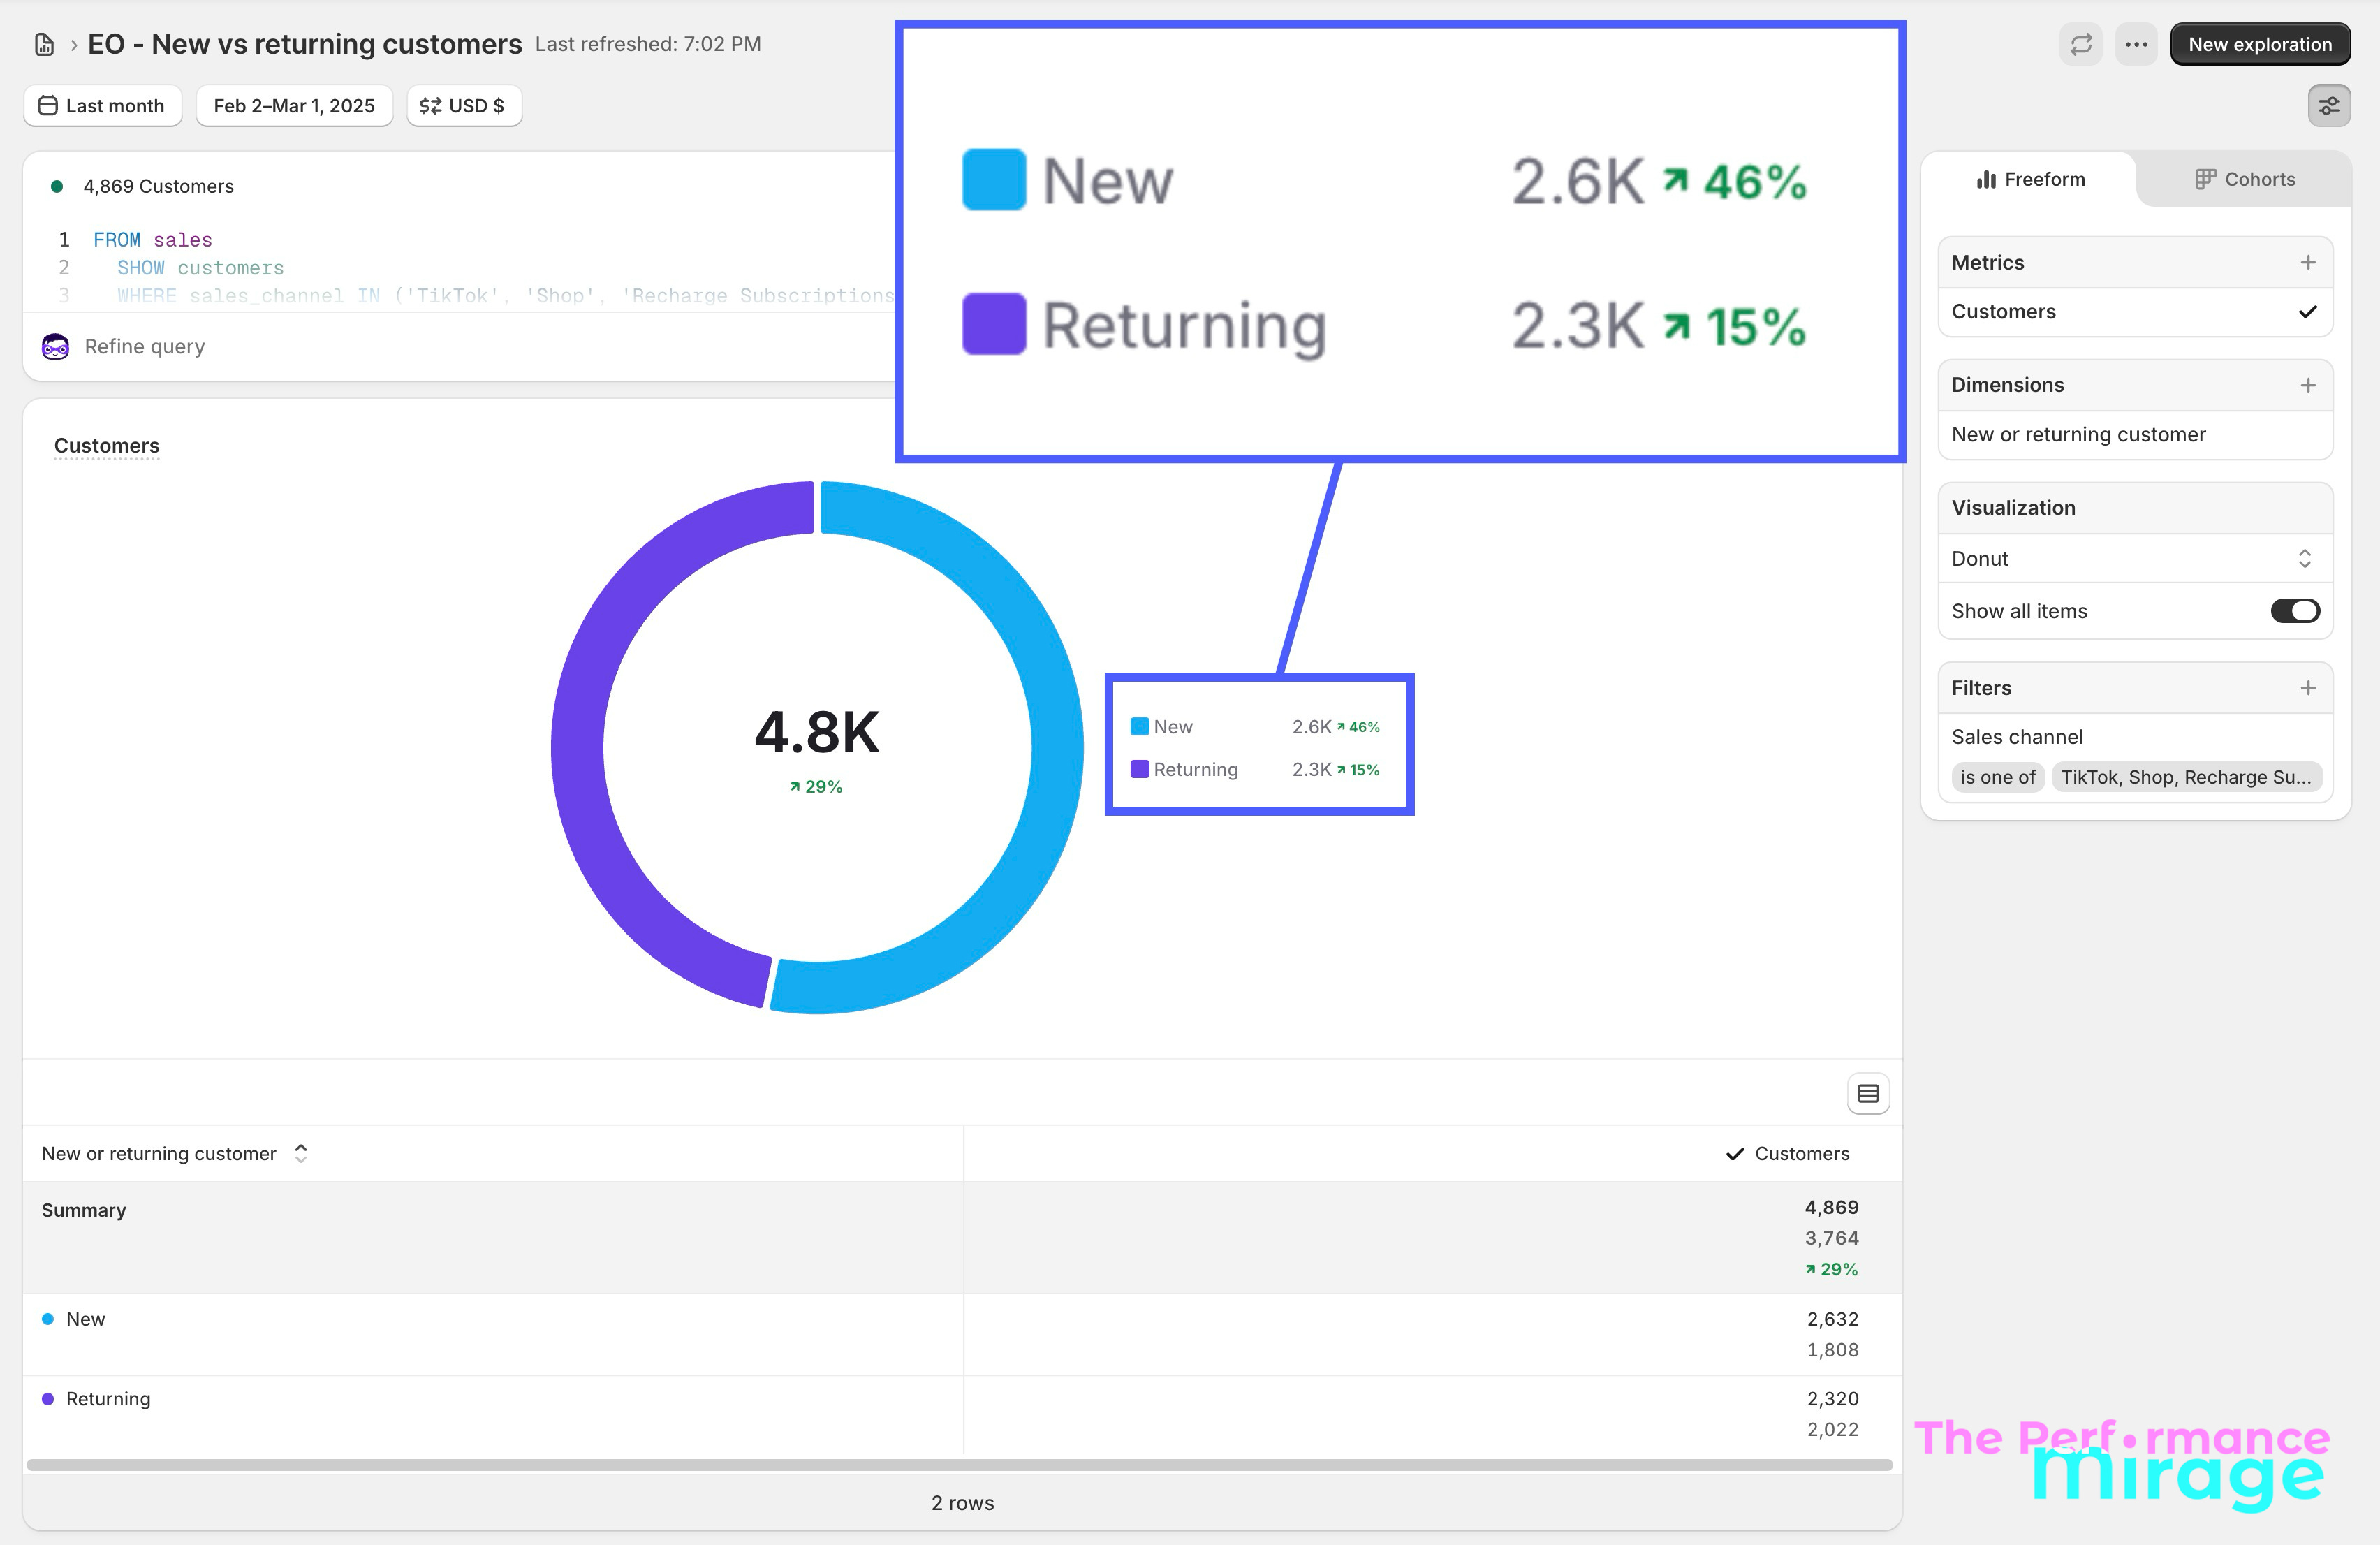
New customers were up 46% year-over-year by February — from 1,803 to 2,609:
Now, a fair question: how do we know it was us?
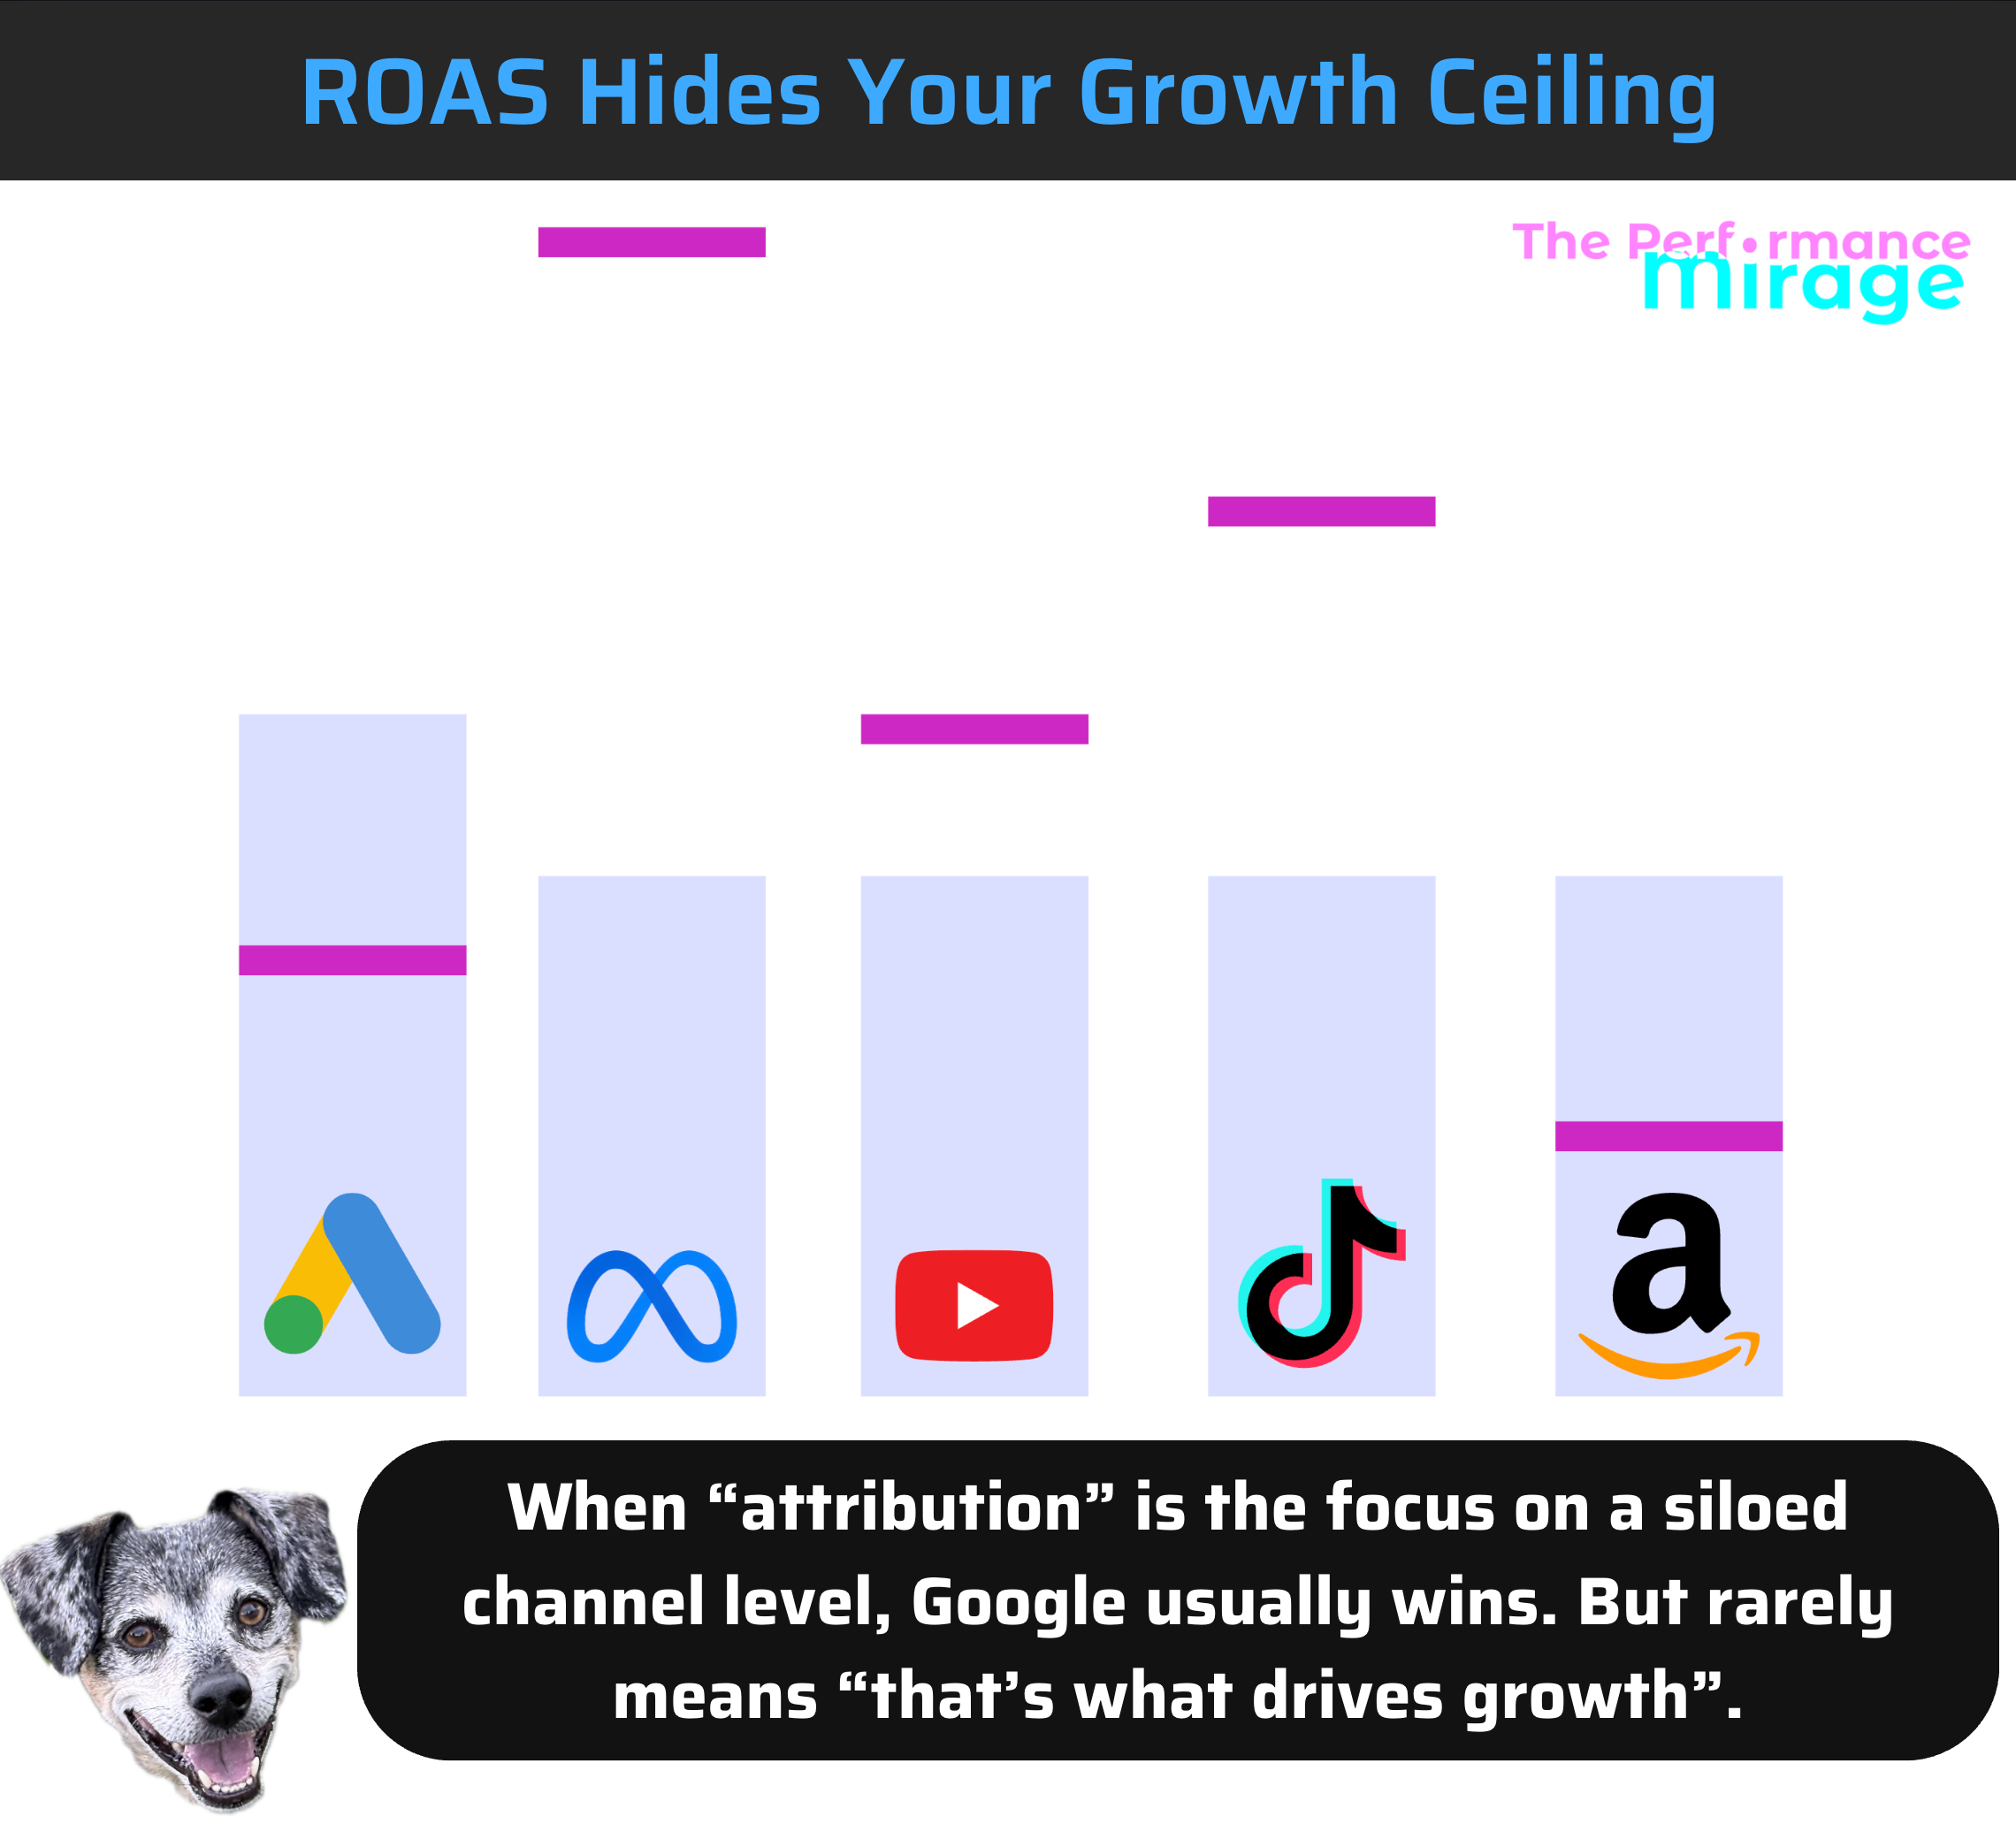
This business runs Google Ads, Meta, and Amazon. Buyers don’t purchase from a single channel — they touch multiple before they convert (like literally all businesses and consumers). That’s exactly why we don’t hang our hat on platform-specific metrics. We focus on business metrics: new customers acquired, nCAC, nMER, and contribution margin (just to name a few). These are the numbers that reflect what’s actually happening inside the business, not what any single platform is claiming credit for.
We are the only thing that changed for this business over the past year. And the business metrics moved. That’s the most honest attribution model there is.
The client’s question at the start of the engagement had been:
“How much do we have to spend?”
It became:
“How much can we spend?”
That’s the difference between an algorithm trained on a mirage and one trained on reality.
The Check
Here’s the question worth sitting with this week:
Do you actually know what your paid advertising is training the algorithm to do?
Not what whoever is running your media buying told you. Not what the platform dashboard implies. What signal is actually going into the algorithm — and whether that signal represents the customers you actually want more of.
Because this isn’t about reporting. We don’t care what the platform says. We care what the bank account says. Those are two very different numbers, and confusing them is exactly how you end up paying $271 for a customer your platform told you cost $6.54.
A few things to audit right now:
What are you actually measuring? Most businesses are overreporting — both in-platform and through third-party attribution tools that claim to solve the problem. They don't. They're just a more expensive guess. All you need is an understanding of how the algorithms work, your e-commerce store's real revenue data, and a sheet tracking the right metrics weekly. We track 12 business metrics — not marketing metrics. There's a difference, and it's the difference between knowing what's actually happening in your business and chasing numbers that make your agency look good.
Can you separate new customers from returning customers in your reporting? If the answer is no, your algorithm is being trained on the wrong audience — warm, returning buyers instead of cold, net-new customers you can actually scale from.
If your in-platform results look too good to be true, they probably are. Google and Meta are taking credit for conversions that were going to happen anyway. I like to say it this way: if my in-platform ROAS looks bad, I know my bank account will look good. That’s not a bug — that’s the point.
That gap between what the platform is claiming and what the business is actually doing? That’s your mirage.
Think this might be happening in your account? Book a free Conversion Diagnostic at Occamize.com and find out exactly where your tracking is lying to your algorithm — and what to fix first.
The Performance Mirage is published by Ryan Levander - founder at Occamize. We help businesses running Meta and Google ads replace broken measurement, bad attribution, and ad-hoc "let's try this" testing with a simple, rigorous optimization process — so you always know what your ad dollars are really doing.